

Graph
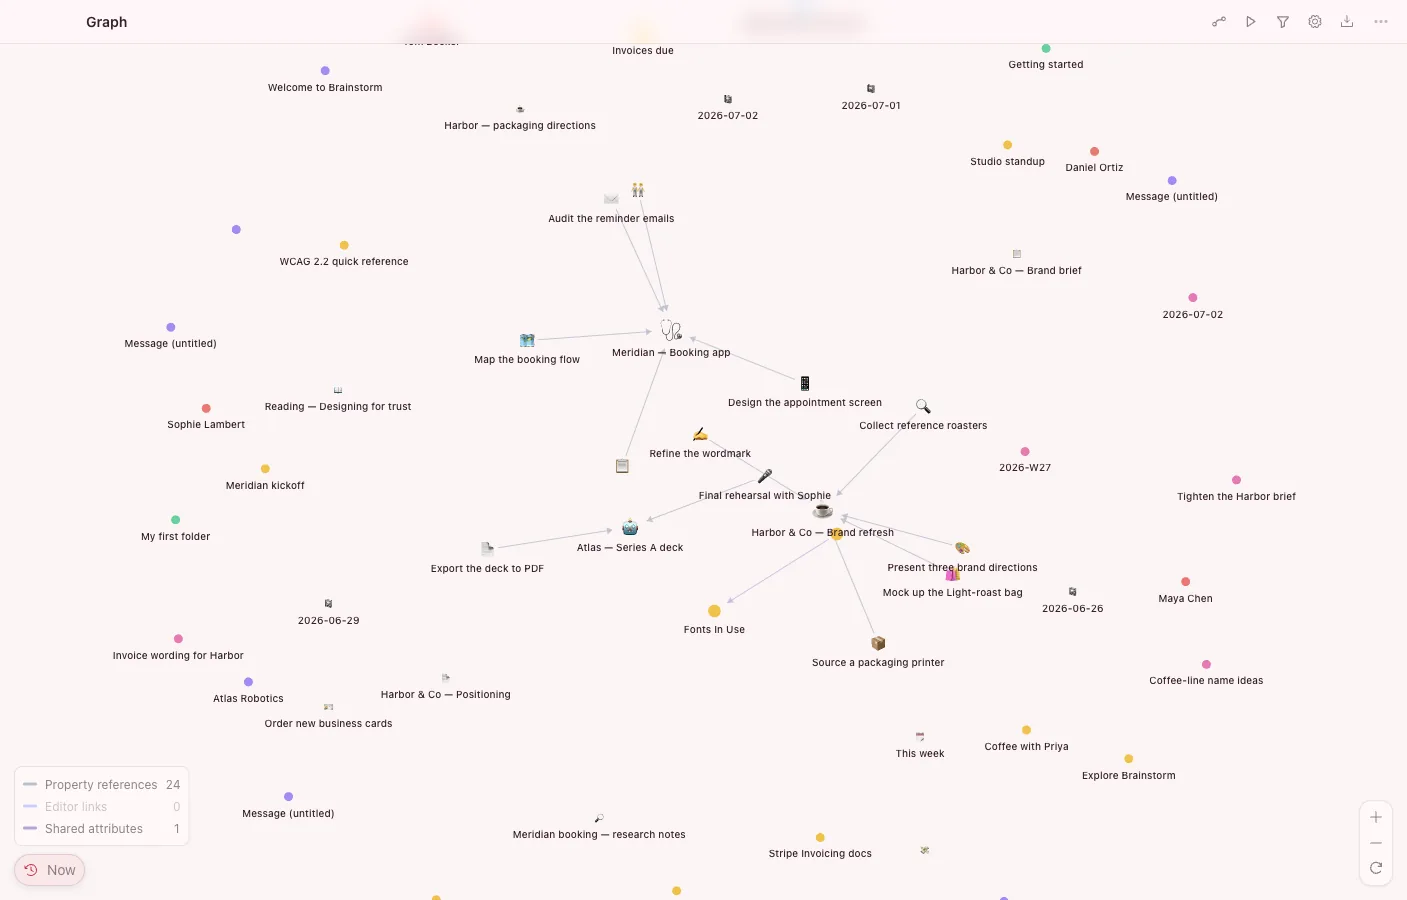
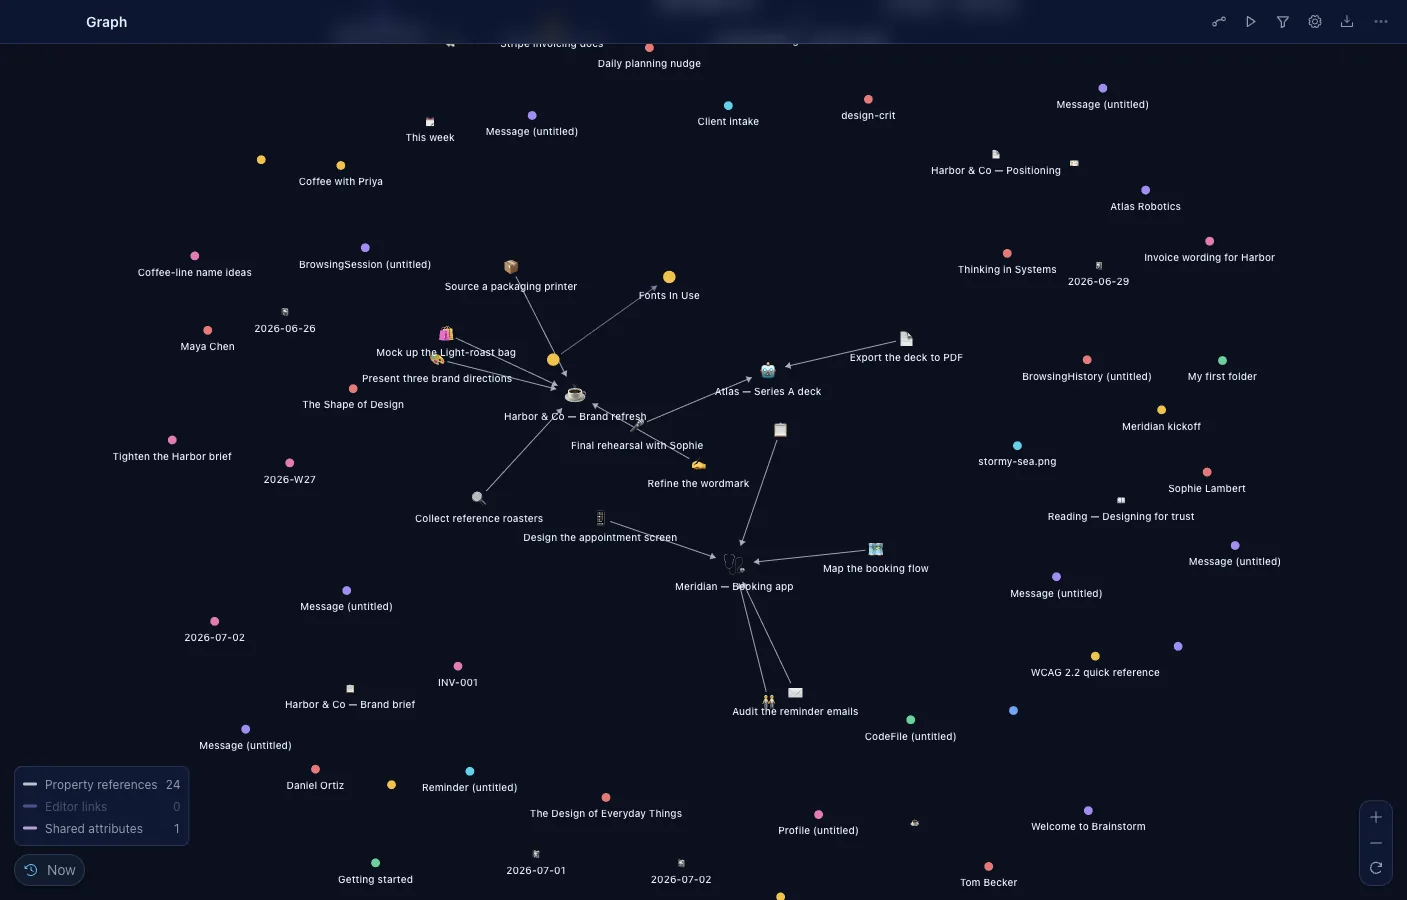
Graph visualizes your vault as what it really is — a web of connected objects. Notes, tasks, files, and the links between them become a map you can explore.
What it can do
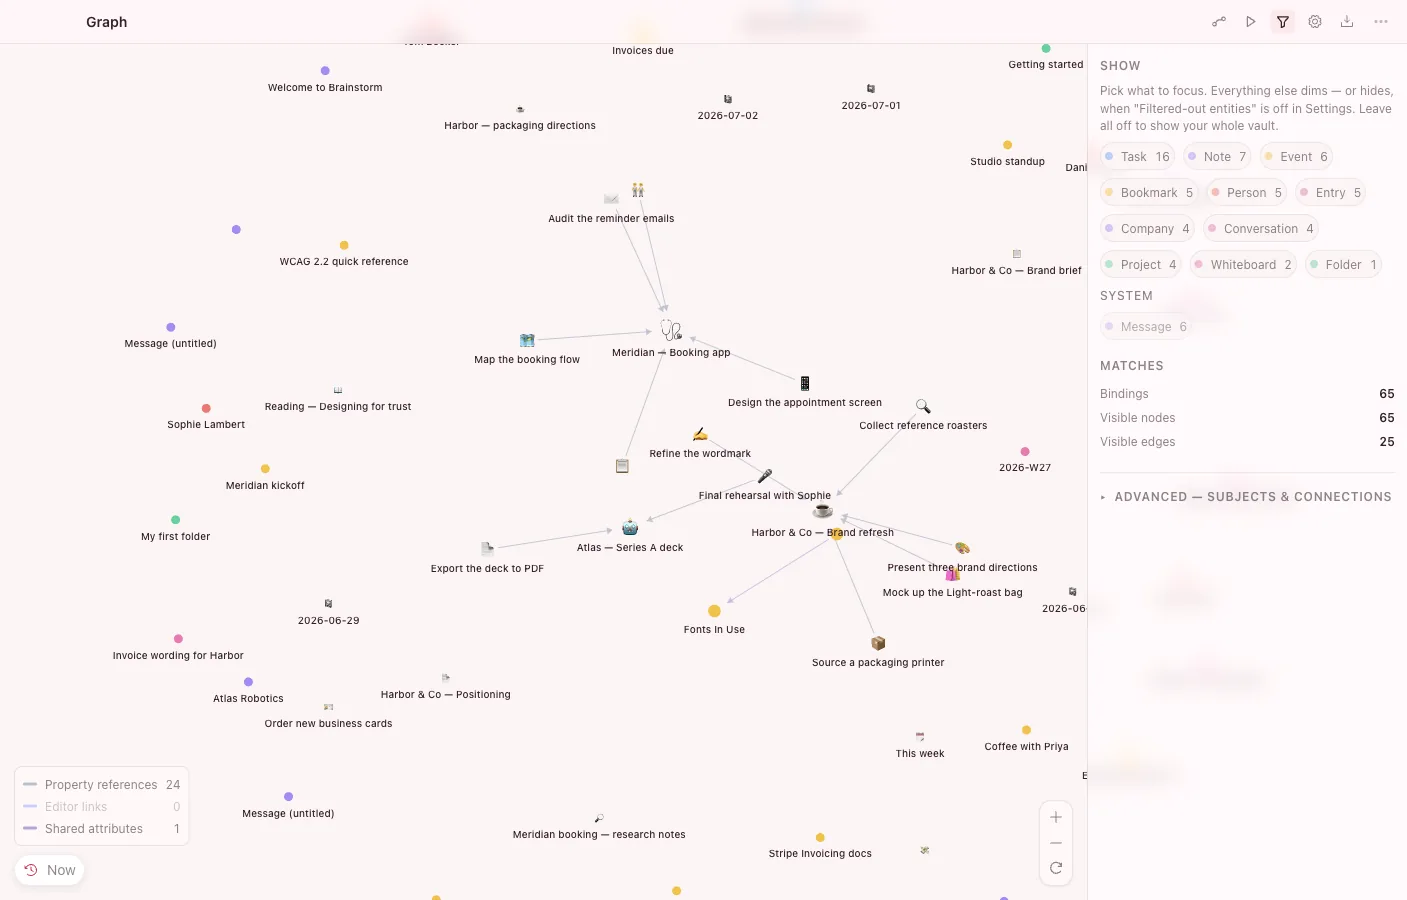
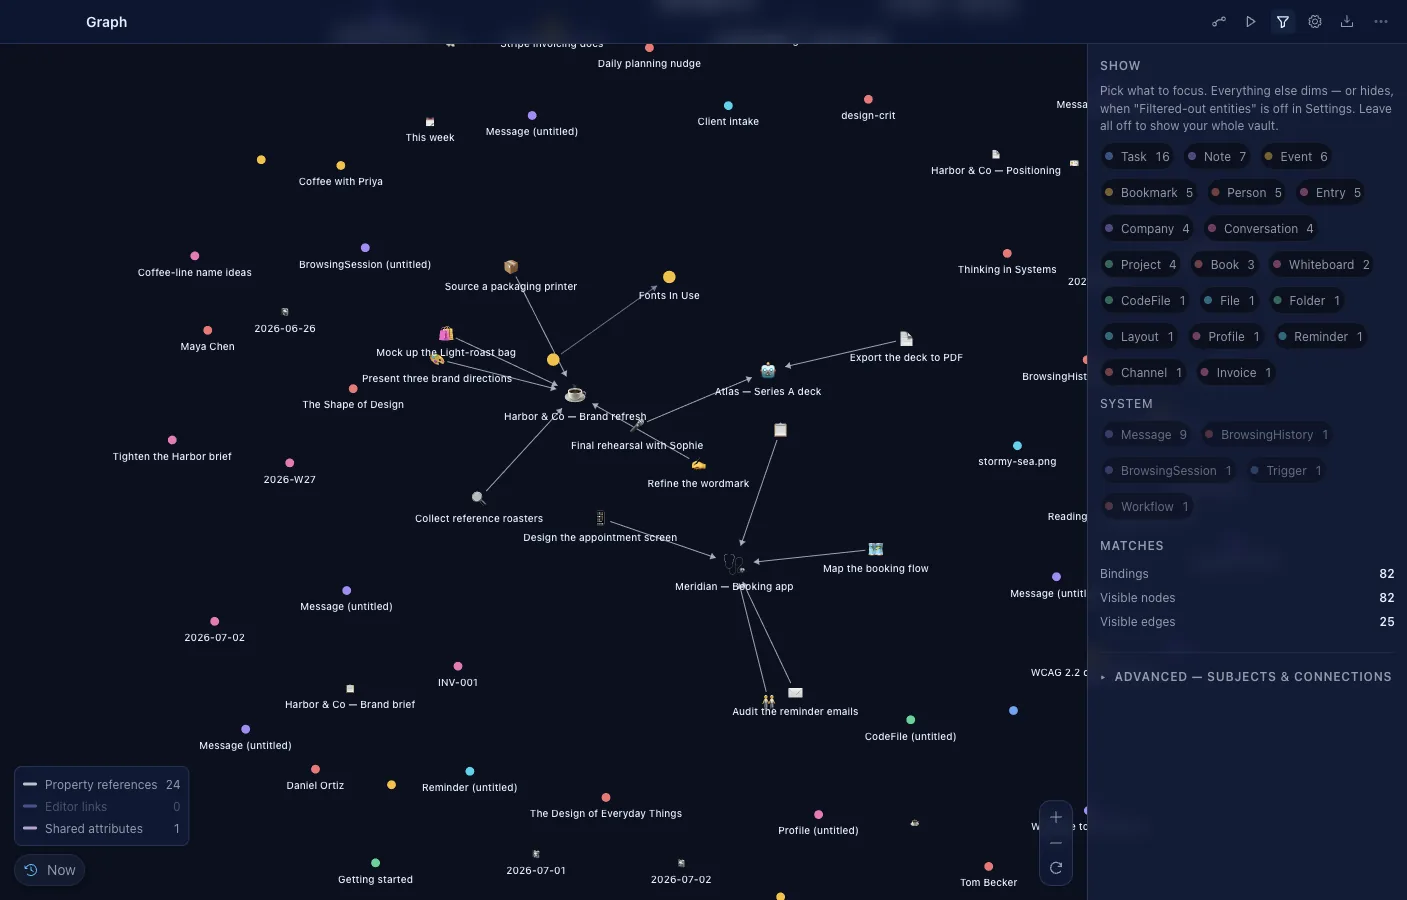
Section titled “What it can do”- Pattern filters describe subjects, typed edges, and per-subject conditions; the query compiles to SQL and stays live.
- Local mode walks 1–10 hops from a root in either or both directions; path mode finds the shortest paths between two objects.
- History animation replays the vault over time with a density histogram and a scrubber.
- Force, radial, hierarchy, and circular layouts; drag nodes, or drag from a handle to create a real typed link.
- An editable inspector changes a node’s properties inline without leaving the canvas.
- Export as JSON, Graphviz DOT, GraphML, or SVG; embed a live graph inside a note.
See the shape of your knowledge
Section titled “See the shape of your knowledge”Every @-mention, collection membership, and relationship becomes an edge. The graph reveals clusters, hubs, and orphans you’d never spot in a list — the note everything points to, the topic that’s drifted off on its own.
Navigate by relationship
Section titled “Navigate by relationship”Click a node to open the object; follow edges to move between related objects. The graph is a way to travel your vault by meaning rather than by folder.
Built for scale
Section titled “Built for scale”The graph renders on a high-performance canvas so it stays smooth as your vault grows into thousands of objects and links.